Image caption
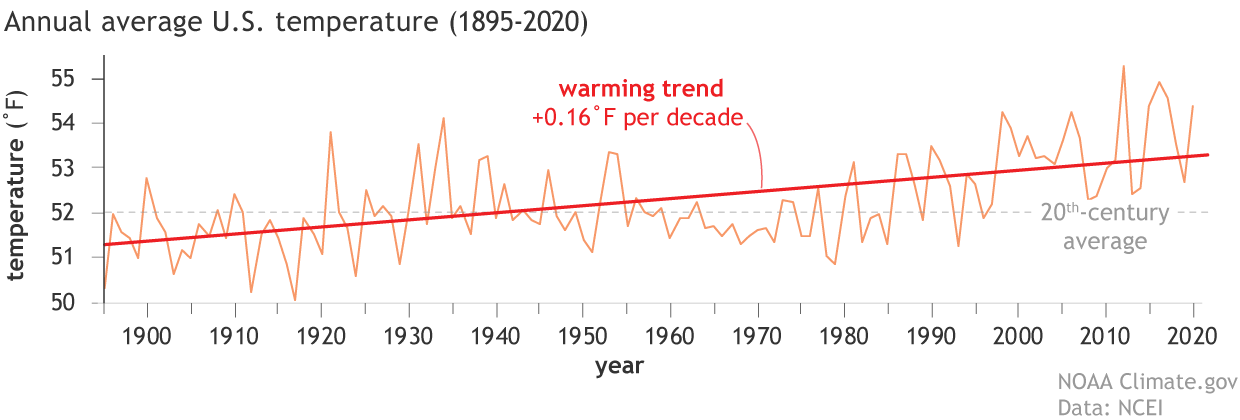
Average annual temperatures for the contiguous United States from 1895 to 2020 (orange line), along with the warming trend of 0.16˚Fahrenheit per decade (red line). Graph by NOAA Climate.gov, based on data from NCEI Climate at a Glance.