Image caption
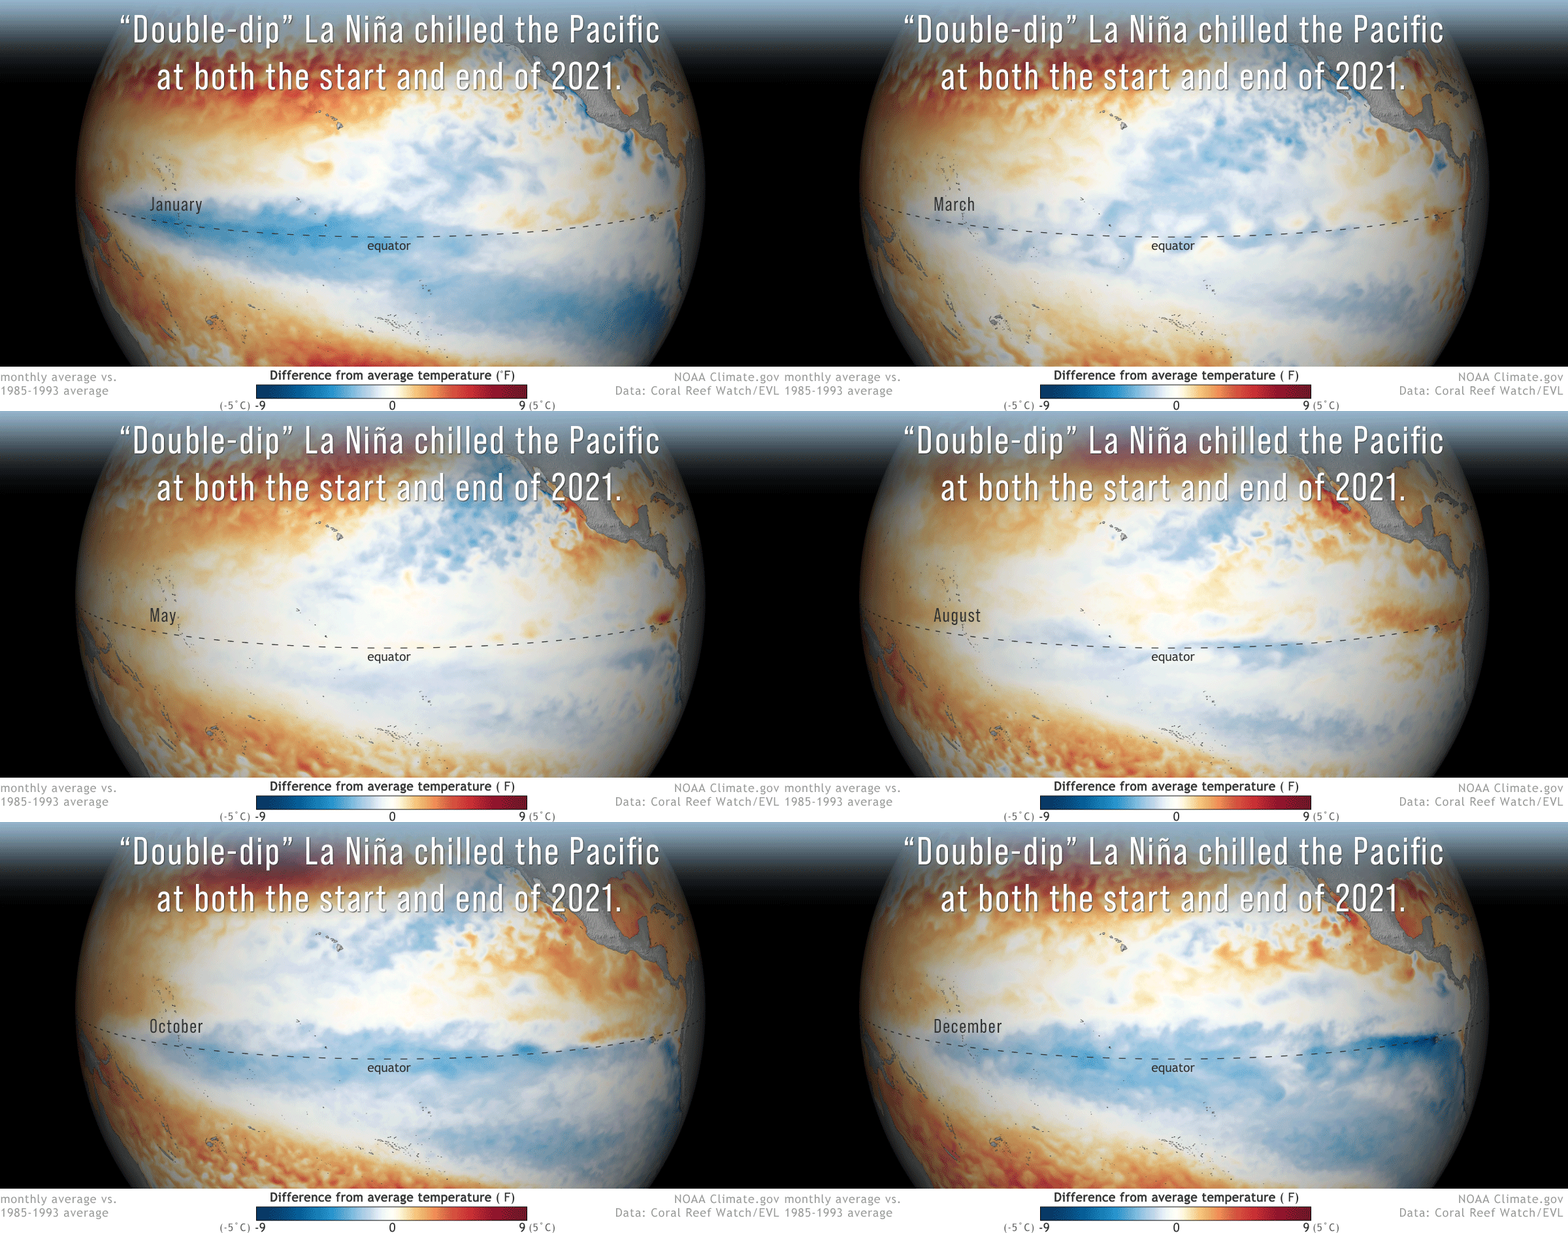
Animation of monthly sea surface temperatures across the Pacific Ocean compared to the 1985-1993 average from January-December 2022. With La Niña—the cool phase of the El Niño-Southern Oscillation climate pattern—in place at the start and end of the year, the Pacific was cooler-than-average (blue) at the equator throughout much of the year. NOAA Climate.gov image, based Coral Reef Watch data. Maps from our Data Snapshots collection.