Image caption
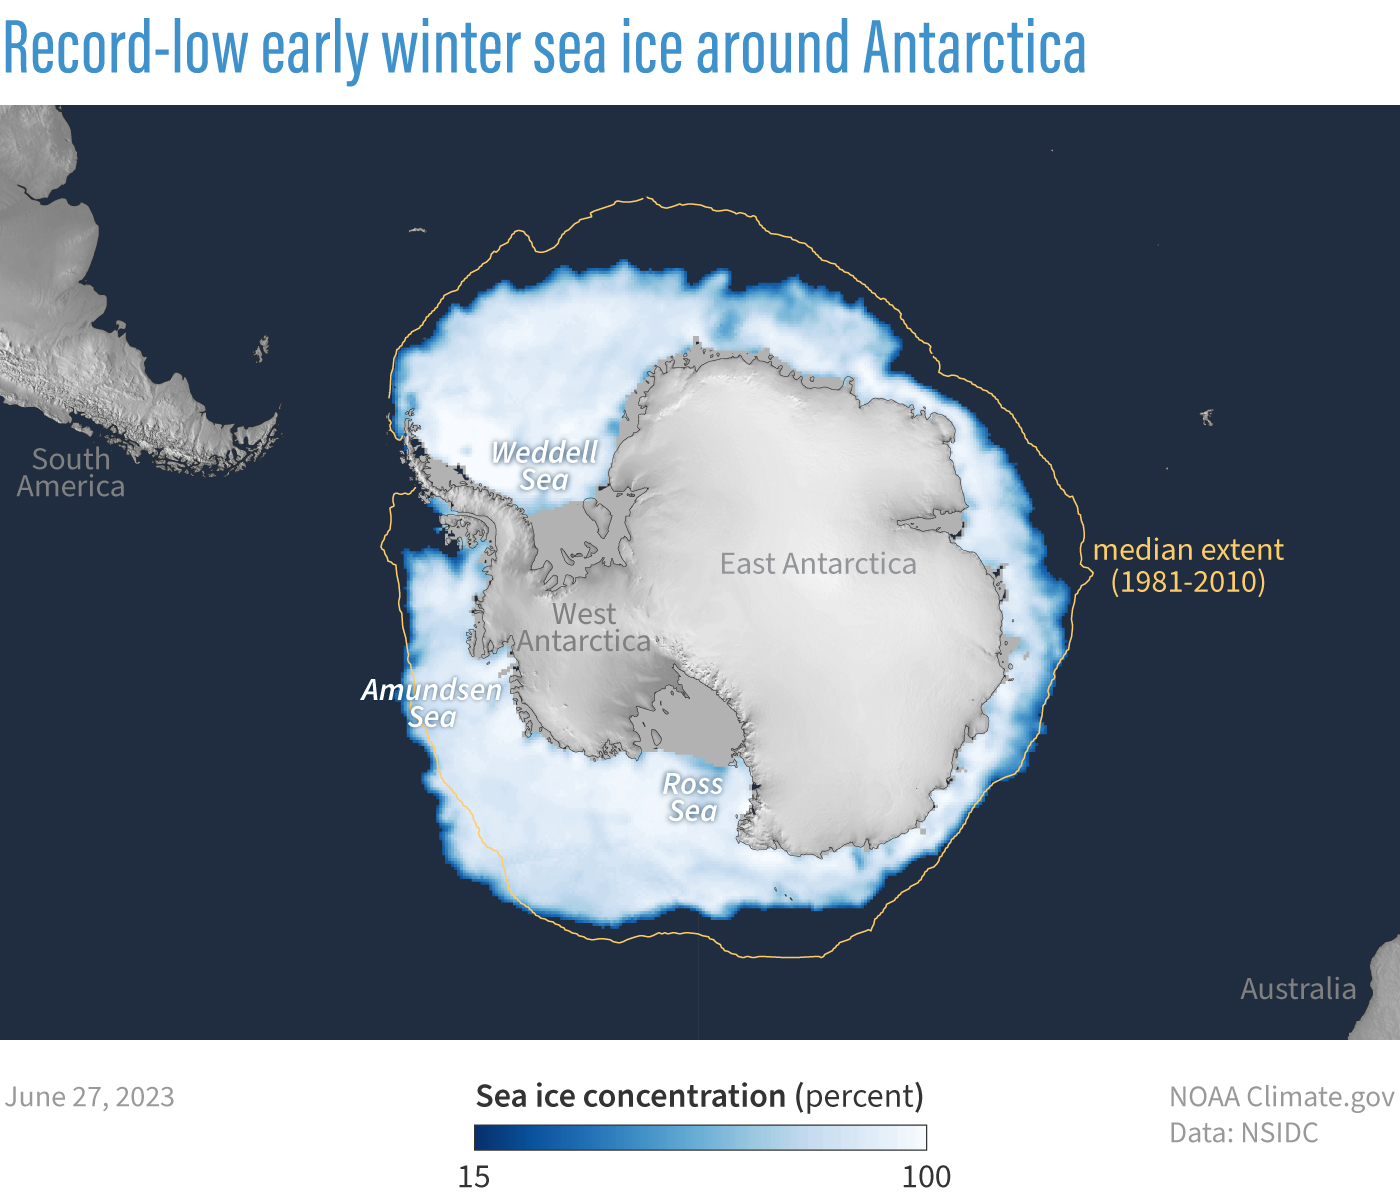
Adapted from NSIDC’s Sea Ice Index, this map shows sea ice concentration on June 27, 2023. Concentration is color coded, with white representing solid ice and dark blue representing open ocean. For reference, this map includes the median ice edge for 1981–2010: half of the years had smaller extents, and half had larger on this date. Map by NOAA Climate.gov, based on data from NSIDC.