Image caption
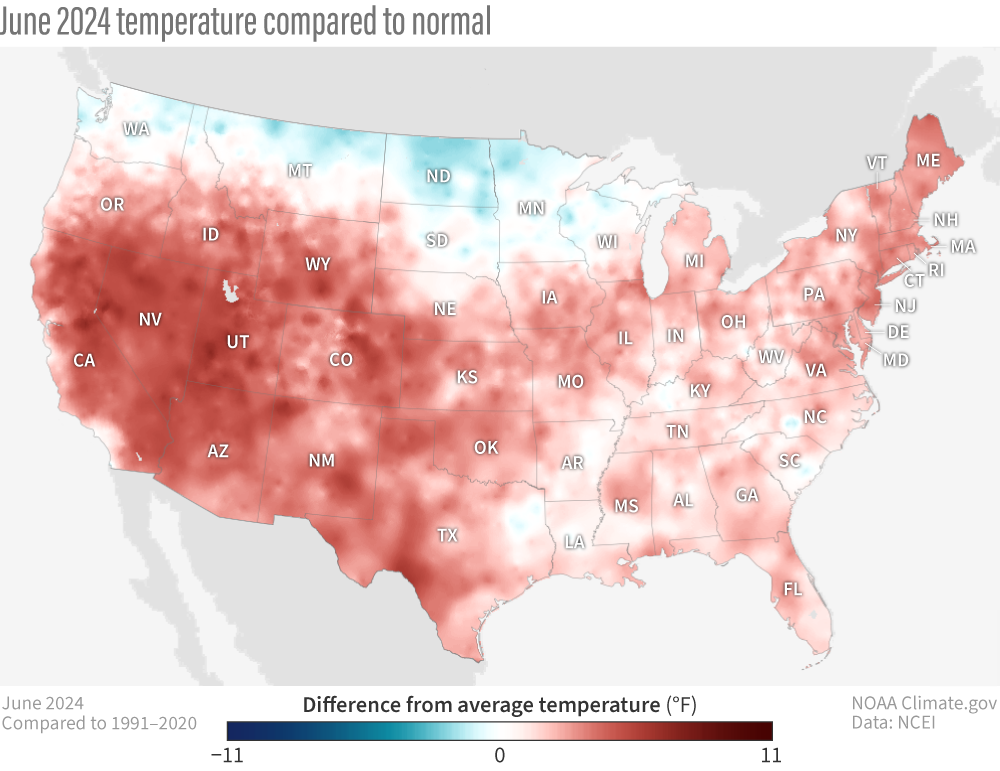
Average temperature in June 2024 compared to normal (1991-2020 average). Places that were warmer than average are red; places that were cooler than average are blue. Nearly the entire contiguous United States was warmer than average. NOAA Climate.gov maps from our Data Snapshots: Temperature collection, based on data from NCEI.