Image caption
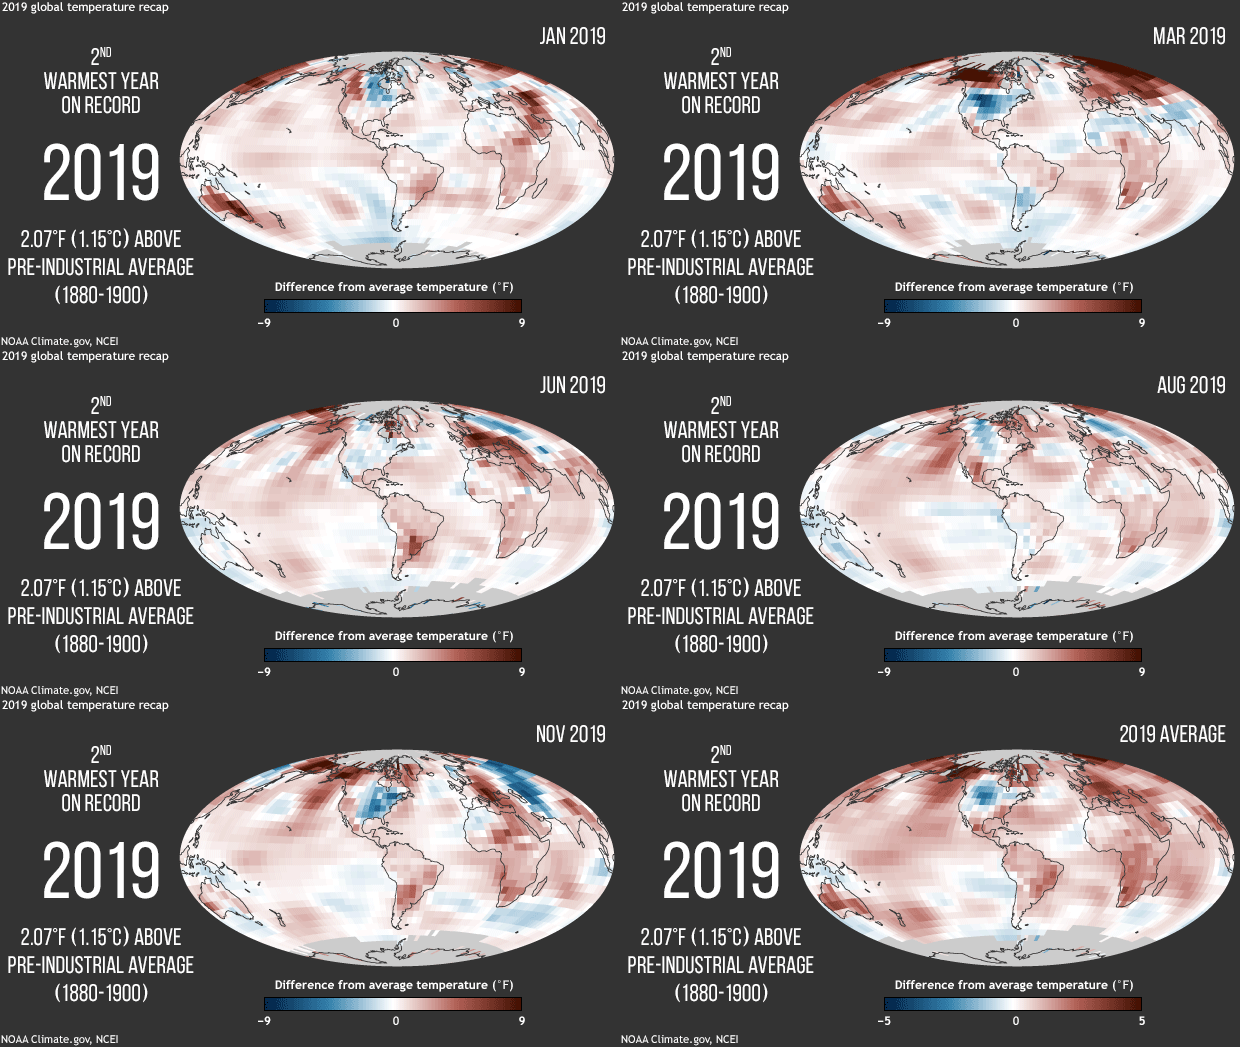
Animated gif of monthly temperatures in 2019 compared to the 1981-2010 average. Final frame of animation shows annual average temperature anomaly. NOAA Climate.gov, based on data from NCEI.

Animated gif of monthly temperatures in 2019 compared to the 1981-2010 average. Final frame of animation shows annual average temperature anomaly. NOAA Climate.gov, based on data from NCEI.