File name: StateoftheClimate2015_carbondioxide_graph_1860.png
Original Resolution: 1860 × 1116
File Size: 514 KB (MIME Type: image/png)
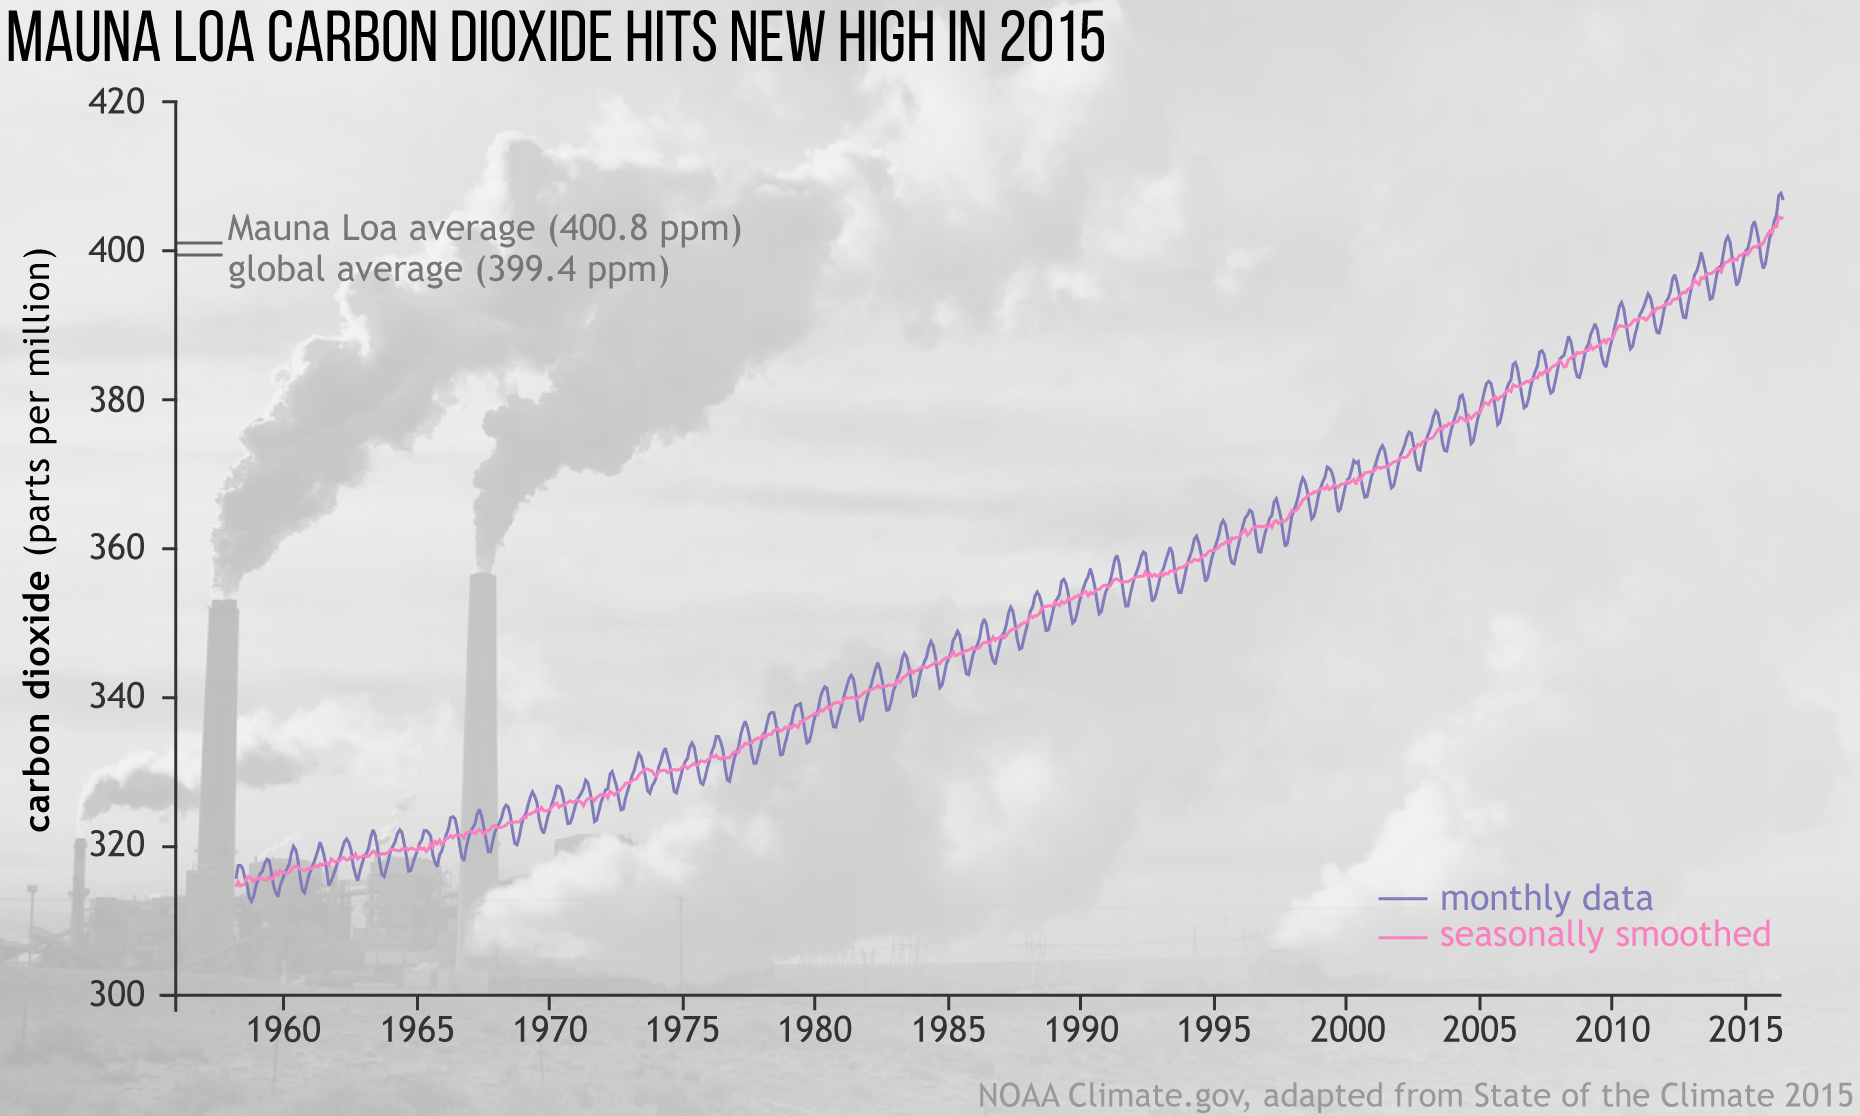
Monthly average carbon dioxide amounts (blue line) measured at Mauna Loa observatory. The bright pink line shows carbon dioxide concentrations with the seasonal cycle smoothed out. Full story.