Image caption
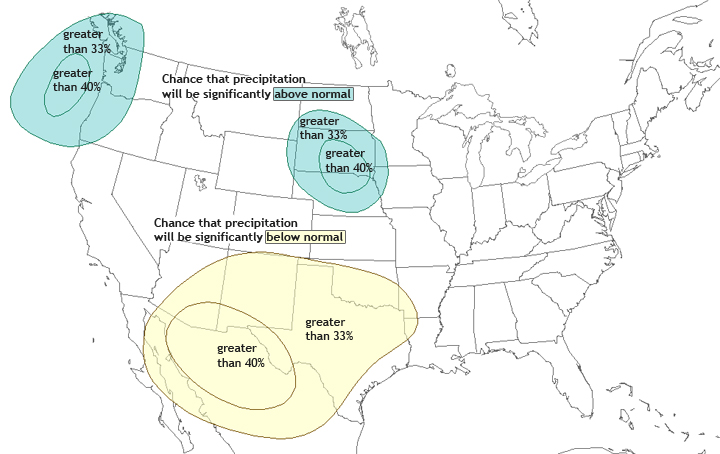
The map shows NOAA’s precipitation outlook for September-November 2011. Blue-green shaded areas are places where precipitation is likely to be significantly above normal, while yellow areas are places likely to experience significantly below-normal precipitation. Moving from the outer edge of the shaded area to the interior, percentages indicate increasing probability of the predicted pattern.