Image caption
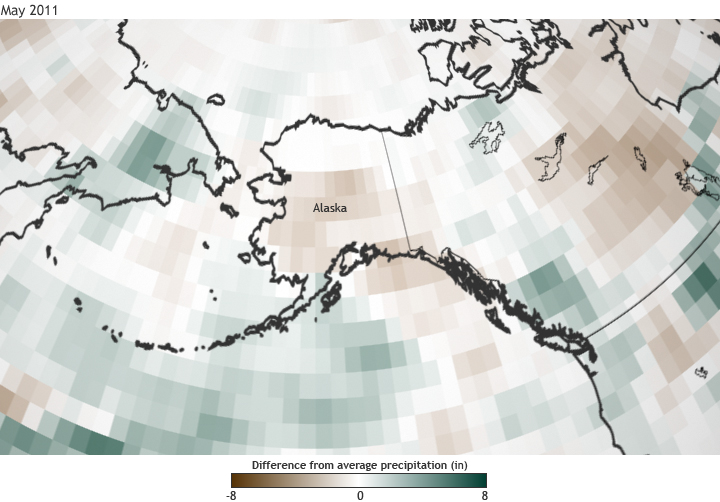
Difference from average precipitation across Alaska for May 2011. Shades of brown indicate areas that received up to eight inches less than average precipitation for the month while green indicates up to eight inches more than average. Based on daily composites of precipitation data from the NCEP/NCAR Reanalysis project, provided by NOAA Earth System Research Laboratory.