File name: NWS_AHPS_southCentralDrought_aug2011_720.jpg
Original Resolution: 720 × 500
File Size: 985 KB (MIME Type: image/jpeg)
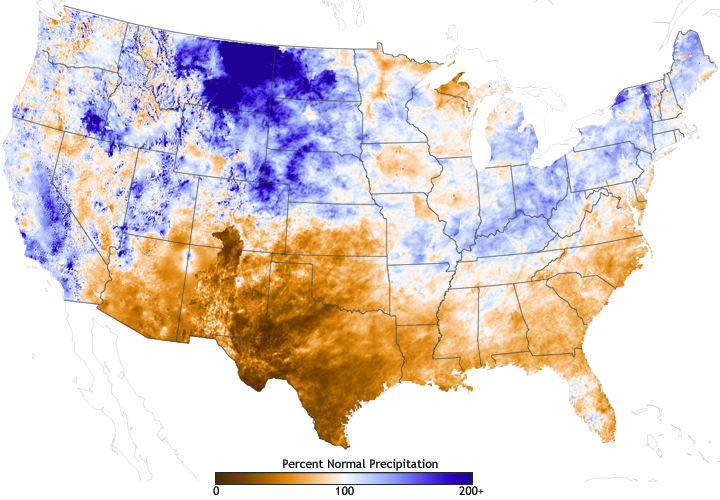
The map above shows the difference from normal precipitation received in the United States between October 1, 2010 (the beginning of the West’s water year) and August 21, 2011. Areas with less-than-normal precipitation are shades of orange and brown, areas with near-normal rainfall are white, and areas where precipitation was above normal are blue. Based on precipitation data from the NOAA/NWS Advanced Hydrologic Prediction Service.