File name: NSIDC_seaice_map_and_chart_20180317_620.jpg
Original Resolution: 620 × 816
File Size: 174 KB (MIME Type: image/jpeg)
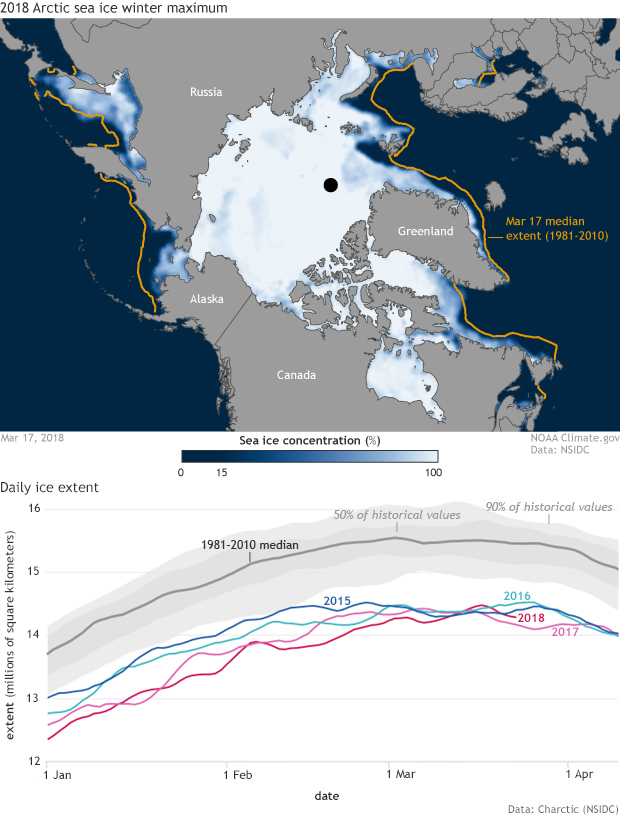
(top) Arctic sea ice concentration on March 17, 2018, compared to the 1981-2010 median (gold line). The graph shows daily ice extent from January-April each year. Image by NOAA Climate.gov, based on data from the National Snow and Ice Data Center.