Interactive map: average date of last spring freeze across the United States
Click the dots to see the average date on which the chance of freezing temperatures drops below 50 percent across the United States, based on the U.S. Climate Normals from 1991–2020. (Launch the map in its own window.) Places where that date occurs near the official start of spring are colored white. Places where the last freezing date occurs before the start of spring on average are in the shades of purple, and places where the last spring freeze occurs after the start of spring on average are colored green. Map by Climate.gov, based on data provided by NOAA National Centers for Environmental Information.
In the weather world, spring got underway March 1, and yesterday was the start of spring by the solar calendar. Another, less-than-official, sign that it is really spring is the day of the last freeze: the date after which temperatures will stay above 32 degrees Fahrenheit for the rest of the season. Of course, that date varies from year to year based on the weather, which means we never know the exact date in any given year until well after it has passed.
What we can know in advance is what the historical chances of freezing temperatures are on any given day based on past climate. The dots on this U.S. map show the average date on which the chances of freezing temperatures drop below 50 percent at weather stations across the United States, based on the 1991-2020 U.S. Climate Normals from NOAAs National Centers for Environmental Information (NCEI). In other words, past the date shown, temperatures have historically been more likely to stay above freezing than to fall below it again for the rest of the spring.
Understanding this map
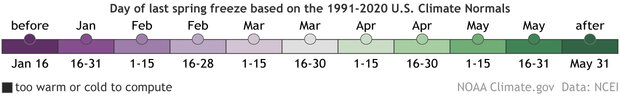
Places where this milestone is reached before the first day of spring in mid-March appear in shades of purple, while places where it comes after that are colored in shades of green. Clearly, from the amount of green, the odds of freezing air temperature remain above 50 percent until after the solar start of spring in most of the Lower 48. As you’d expect, the farther north or higher in elevation you go, the later in the season (darker greens) this day generally arrives.
Click on the colored dots to show the exact values at individual weather stations, along with the station name. The background map shows interpolated values for all locations in the Lower 48 states. (Interpolating means estimating values where you don’t have direct observations, using existing observations and physical relationships, such as the way temperature changes with altitude.)
Gray squares are places where no date could be calculated. Either that location is so chilly that the chance of freezing temperatures is higher than 50 percent all spring (possibly even all year, as in parts of Alaska or the highest peaks of the Western mountains), or it is so warm that the chance of freezing temperatures is below 50 percent all spring or all year.
Protecting your tomatoes
If you’re trying to decide when it’s safe to move your precious tomato seedling outdoors, you might feel like “below 50 percent chance” is still too risky. No worries: the U.S. Climate Normals have you covered. The Normals also include the dates past which the chances of freezing temperatures drop below 40, 30, 20, and 10 percent. To find these data for your location,
- visit the Annual/Seasonal Normals page at NCEI,
- under Data Type search box, click “show list,”
- scroll way down to near the bottom of the list, and check the box next to “10% probability date of last 32F occurrence or later,” and click “Accept,”
- scroll down the page to the results section, and click “Preview.”
- You’ll get a table of results showing the dates on which the probability drops below a given threshold. Here’s the results for Boulder, Colorado, for example. The date past which chances of a freeze drop below 50 percent is May 6. If you want to keep your seedlings in until the probability drops below 10 percent, however, you’ll want to wait until after May 18.
On the other hand, if you’re the kind of person who wants to avoid all risk, then you’ll probably want to consult the Global Historical Climatology Network-Daily data to find out the very latest freeze that’s ever occurred at or near your location, and of course, keep a close eye on NOAA’s 6-10 day temperature outlooks, and your local weather forecast.
Happy spring from Climate.gov…and good luck with your tomatoes!