Revisiting La Nina and winter snowfall
I’ll cut to the chase. Spooky season is coming to an end, and people are beginning to set their sights on winter. And when it comes to winter, there’s a big, white, abominable “elephant” in the room. Snow. While you’re not going to find a seasonal snowfall prediction here at the ENSO Blog, what we can do, given that La Niña is favored this winter, is revisit the historical relationship between La Niña and snow across North America. Just promise to not take it out on your lowly ENSO Blogger if history suggests more of a winter nightmare than a winter wonderland.
Haven’t you covered this before?
Yes…and no. Back in 2017, Stephen Baxter did indeed write a very popular post on snow and La Niña winters. So why am I revisiting this topic? Well, the dataset used in that post stopped updating in 2009, or 15 years ago. And nowadays, we have access to a new snow dataset from the ECMWF ERA5 reanalysis (learn more about what that in footnote 1). Snowfall, not snow accumulations. If this dataset seems familiar, it’s because last year Michelle and Brian Brettschneider used it to look at snowfall over North America during El Niño winters (footnote 2). So let’s dig in!
What does La Nina usually do?
A quick reminder on what La Niña typically means for the atmosphere over North America during winter. During La Niña, the jet stream, that river of air 30-40,000 feet in the atmosphere that serves as a storm highway, shifts northward across the eastern Pacific Ocean. This causes a ripple effect on the atmosphere across North America. A high-pressure system tends to set up south of Alaska in the north Pacific Ocean and acts like an atmospheric boulder, forcing storms up and around. Downstream over the eastern U.S., the jet stream then dips south in response.

During La Niña, the Pacific jet stream often meanders high into the North Pacific. Southern and interior Alaska and the Pacific Northwest tend to be cooler and wetter than average, and the southern tier of U.S. states—from California to the Carolinas—tends to be warmer and drier than average. Farther north, the Ohio and Upper Mississippi River Valleys may be wetter than usual. Climate.gov image.
The end result is colder temperatures across western Canada and northwest/northcentral U.S. and warmer and drier-than-average conditions over the southern U.S. Wetter conditions also prevail in the Pacific Northwest and Ohio River Valley as storms follow around the blocking high in the Pacific or across more northern areas near the Great Lakes.
How does that translate to snow?
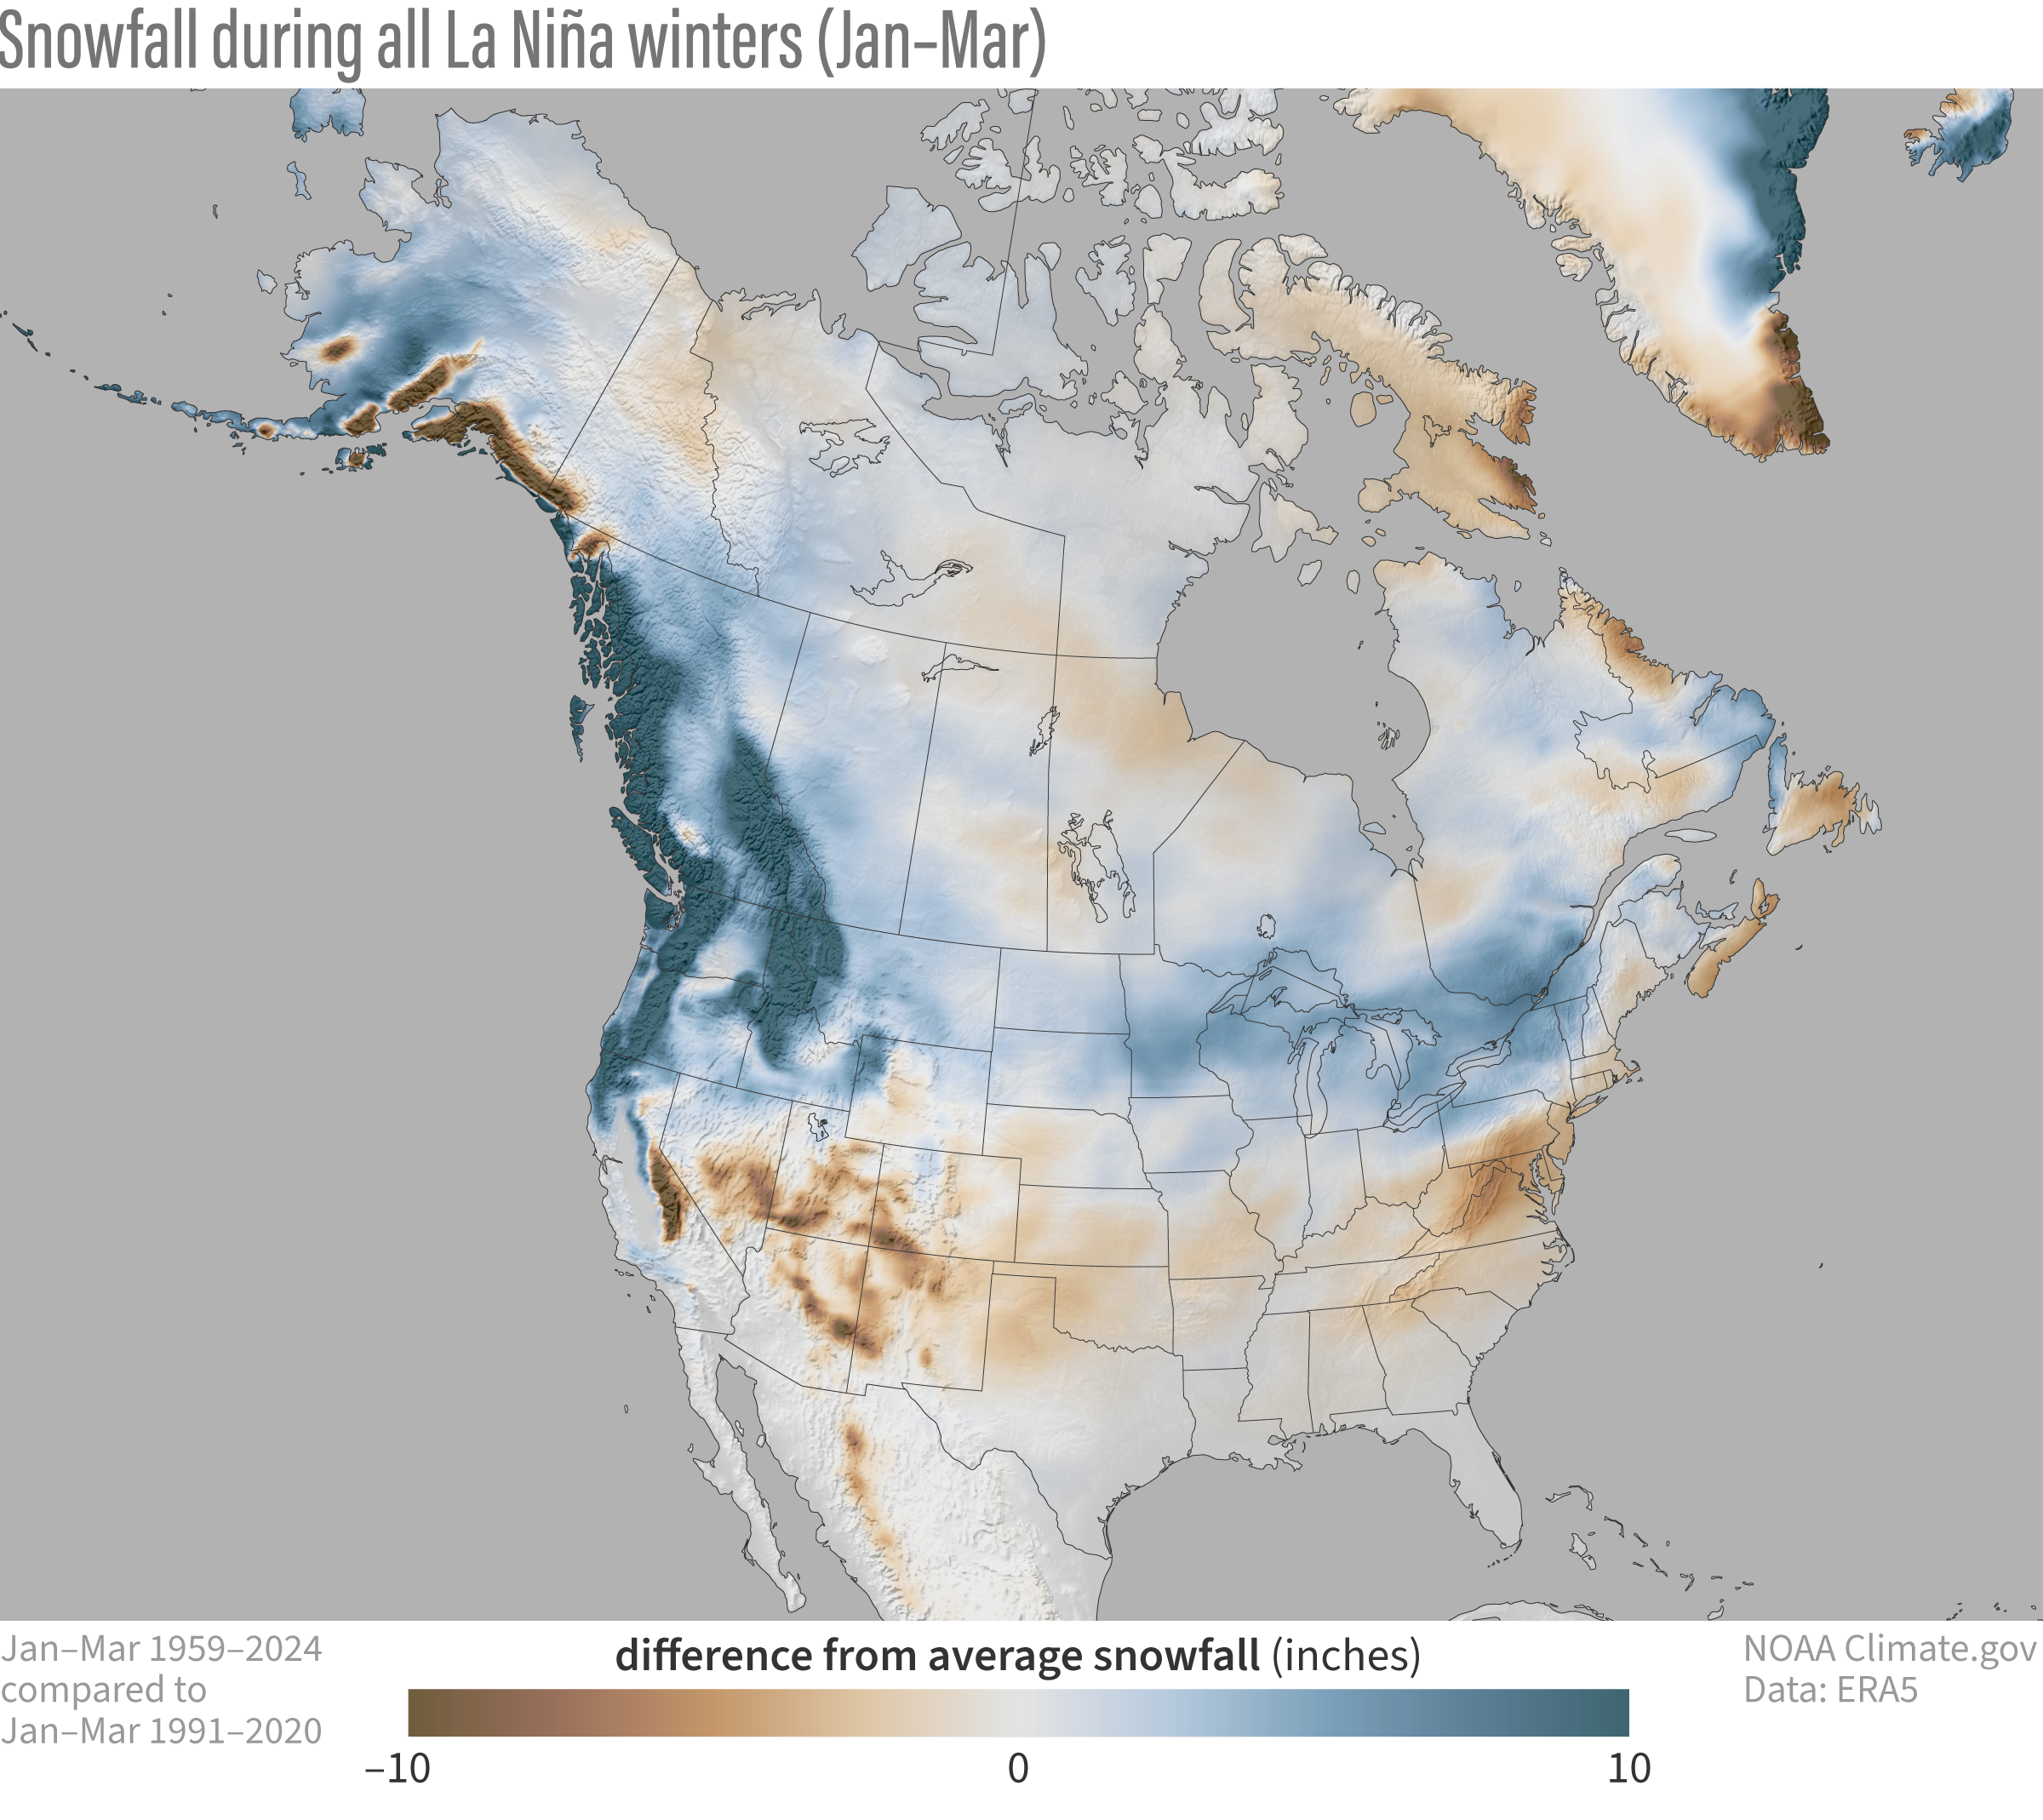
Some patterns jump out when looking at how snowfall differed from normal (the 1991-2020 average) for all La Niña winters from 1959-2024. La Niña winters tended to be banner years for snow across western Canada, the Pacific Northwest, and the northern Rockies. Snowfall also was above-average across the Great Lakes into northern New England. On the flip side, the southern tier of the United States observes below-average snowfall amounts.

January–March snowfall during all 22 La Niña winters from 1959–2024 compared to the average for all January–March periods from 1991–2020. The long-term trend in snowfall over this period has been removed, meaning the maps better show the influence of La Niña on its own. NOAA Climate.gov map, based on ERA5 reanalysis data and analysis by Michelle L’Heureux.
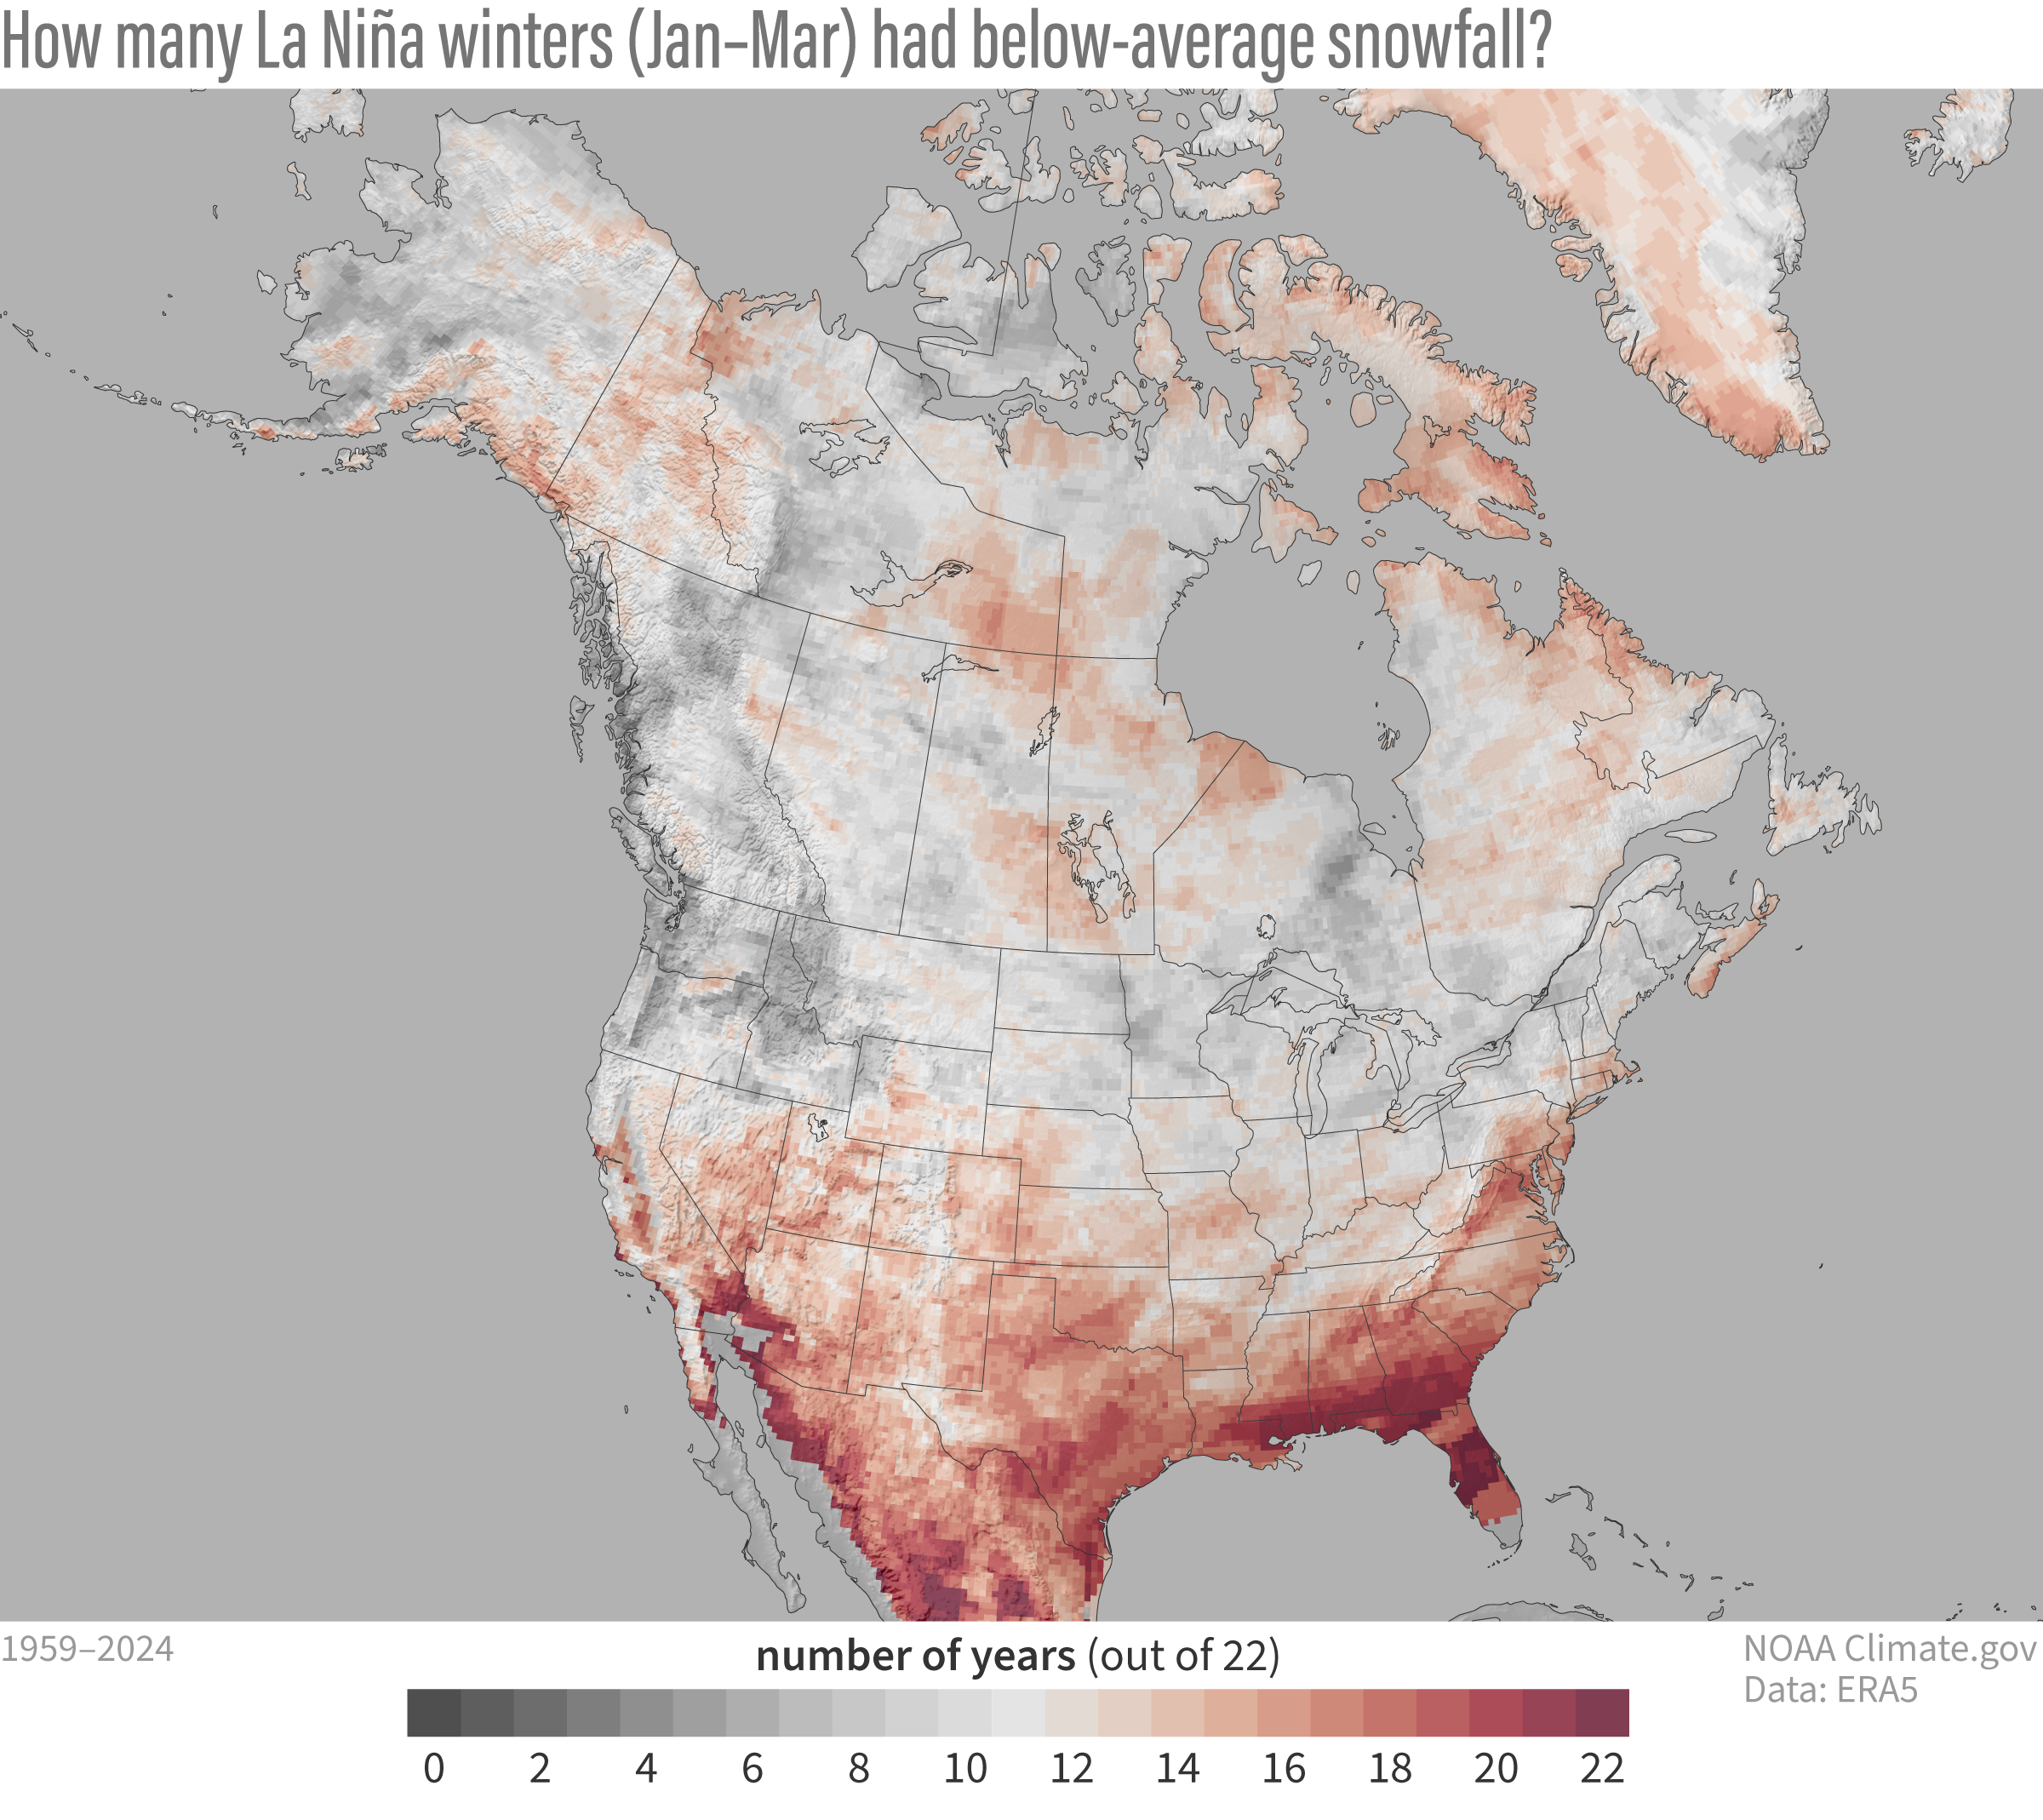
Using averages, though, can have a drawback. For one, a couple BIG snow years could make the overall average look snowier than what we typically experience. To deal with that, we can look at the 22 La Niña events on record and count those with below-average snowfall. Using this metric, the signal for above-average snow is particularly robust across the Pacific Northwest and Idaho, as out of 22 La Niña events, less than seven winters had below-average snow. Meanwhile, bad news for snow-lovers in the Mid-Atlantic: more than 15 La Niña winters had below-average snow.

This map shows how many of the 22 historical La Niña winters from 1959–2024 had below-average snowfall from January–March. Red colors mean those places had below-average snowfall more than half the time. Gray colors mean those places had below-average snowfall less than half the time. The long-term trend has been removed to better show the influence of La Niña on its own. NOAA Climate.gov map, based on ERA5 reanalysis data and analysis by Michelle L’Heureux.
Now just for weak La Ninas!
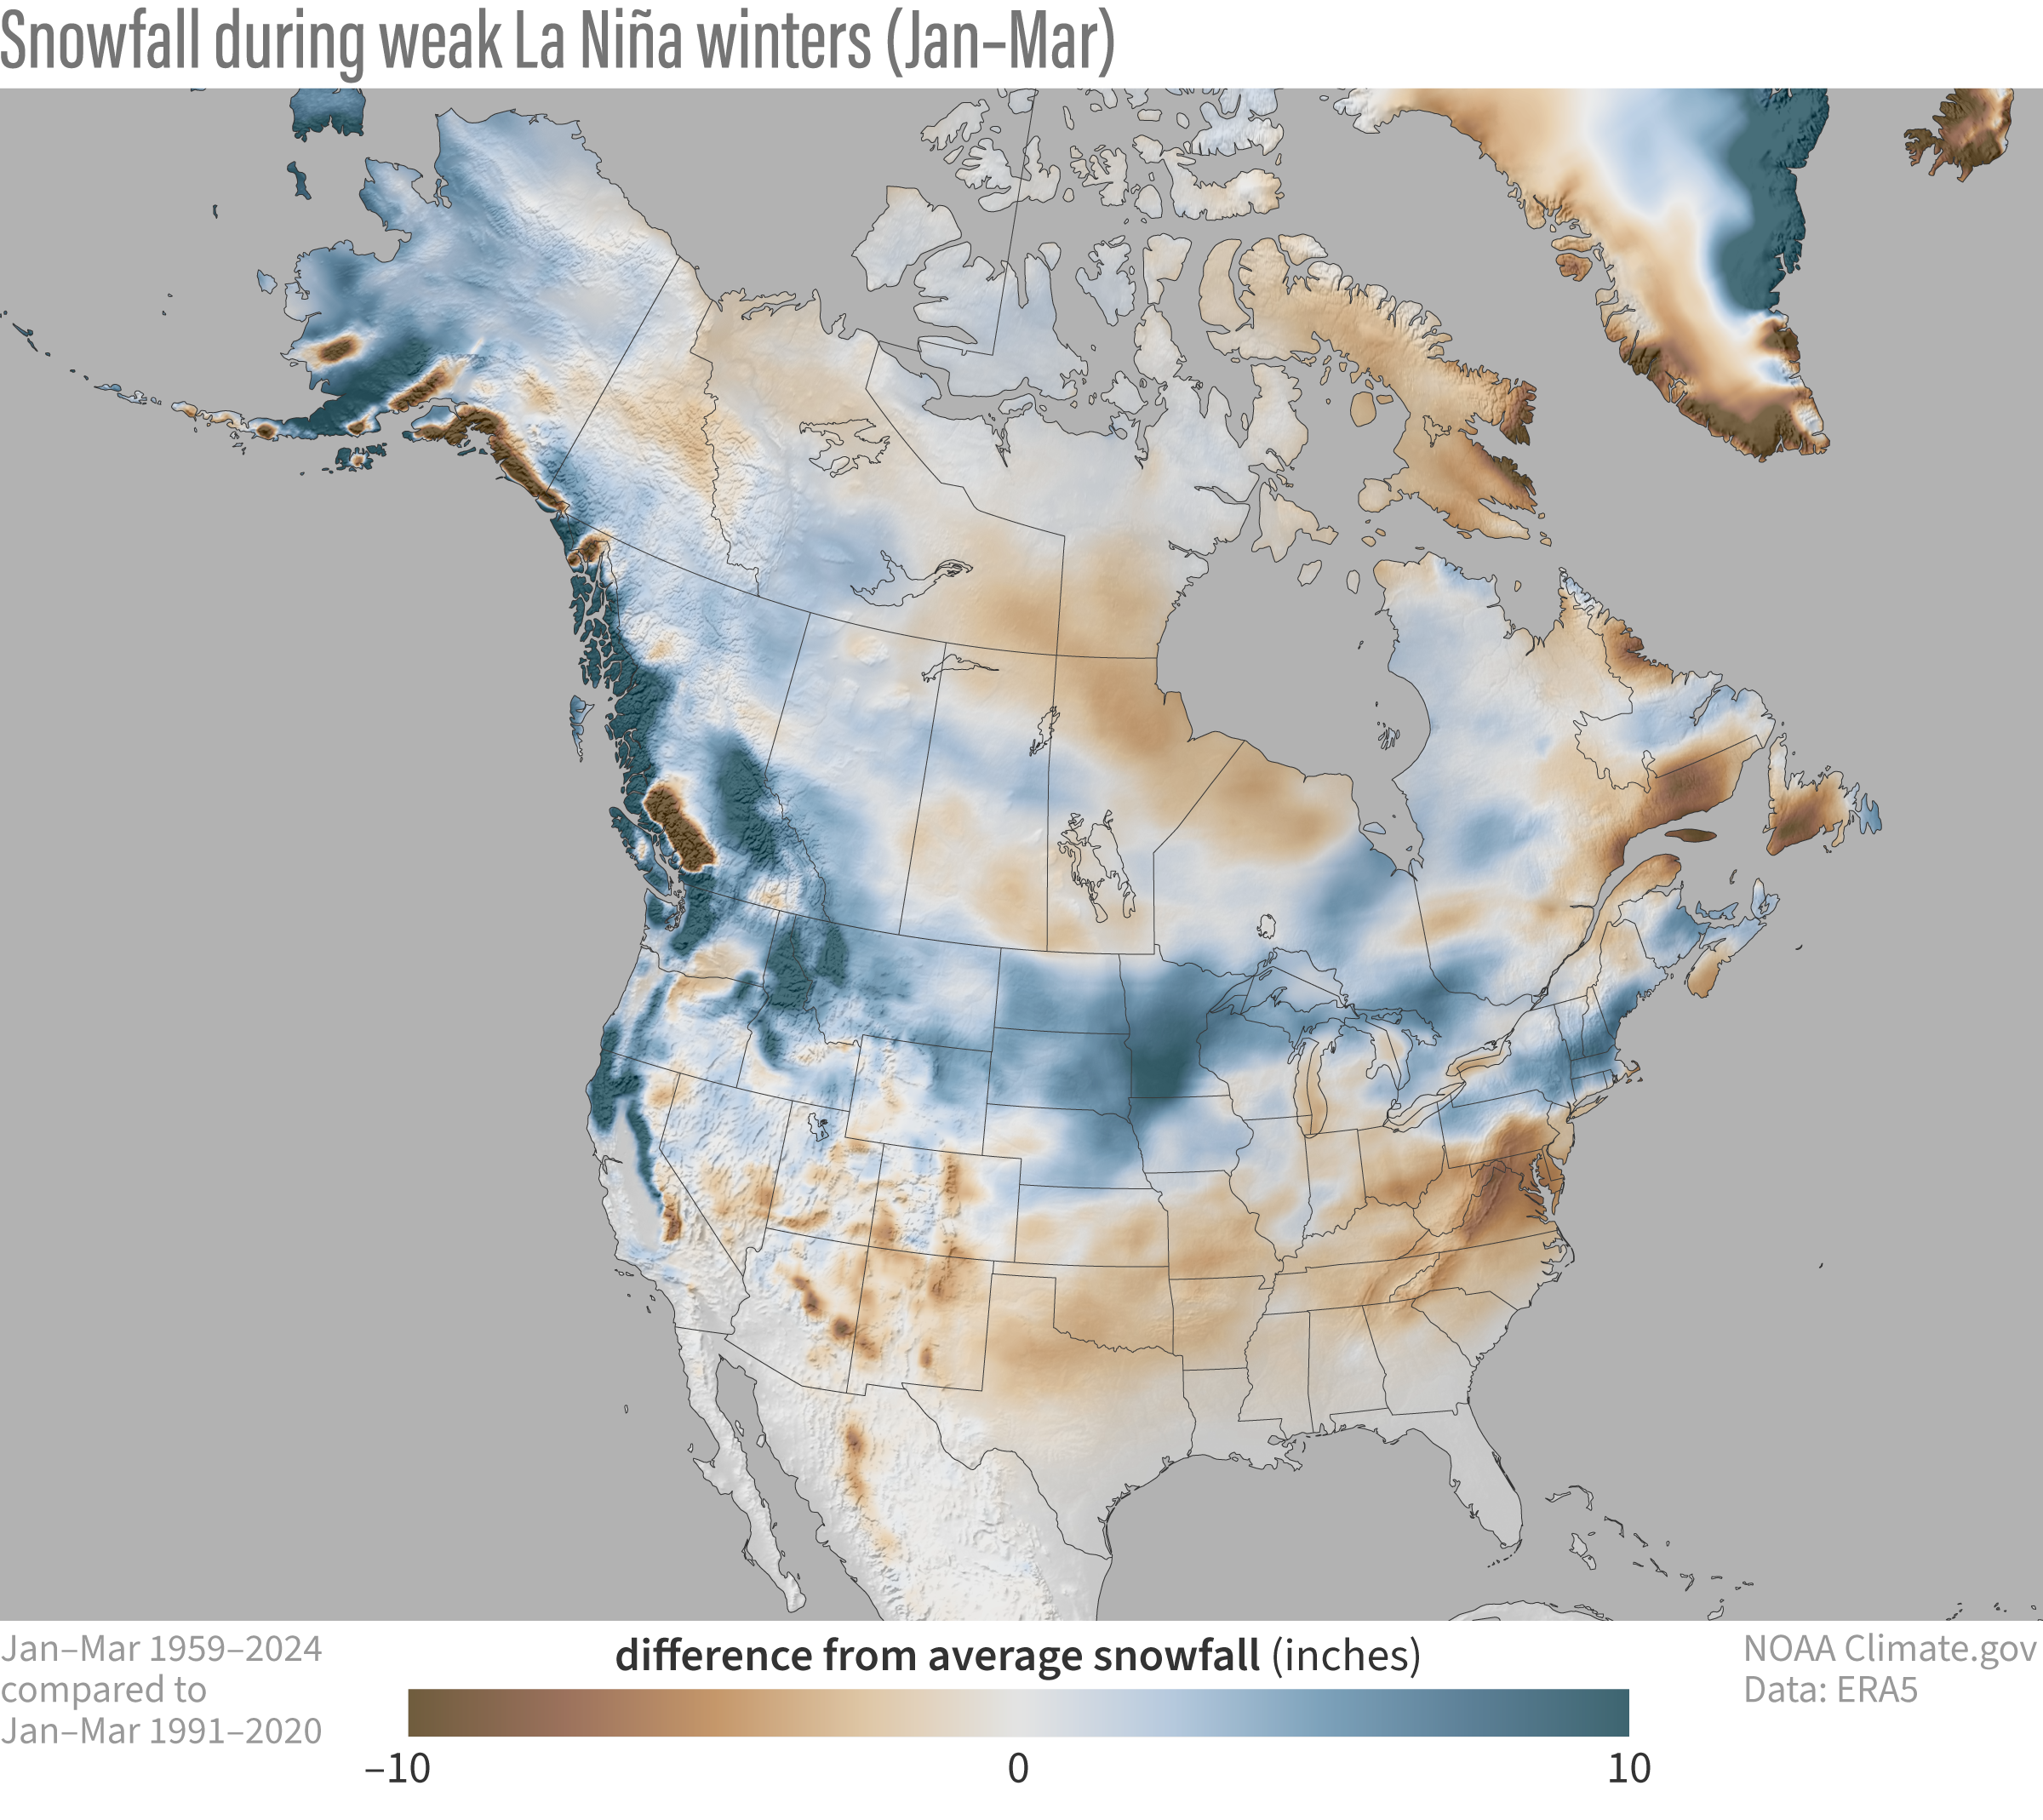
This winter, if a La Niña forms, we’re expecting it to be a weak event. If you remember, a weaker La Niña means a weaker punch on the atmosphere and a less consistent impact on climate across North America. In the nine previous weak La Niña events, the pattern of snow was similar to that of all La Niña events with above-average snowfall observed, on-average, across the northwest and north central U.S. with below-average snowfall farther south.

January–March snowfall during 9 weak La Niña winters from 1959–2024 compared to the average for all January–March periods from 1991–2020. The long-term trend in snowfall over this period has been removed, meaning the maps better show the influence of weak La Niñas by themselves. NOAA Climate.gov map, based on ERA5 reanalysis data and analysis by Michelle L’Heureux.
But there were some exceptions. The north-central U.S. including the Dakotas and Minnesota had an even snowier signal during weak La Niñas than the average of all La Niñas. Meanwhile, the Pacific Northwest wasn’t as snowy as compared to all La Niña events, and snowfall was actually well-below average (not above-average like in the all-La Niña event case) just over the border in southwestern Canada.
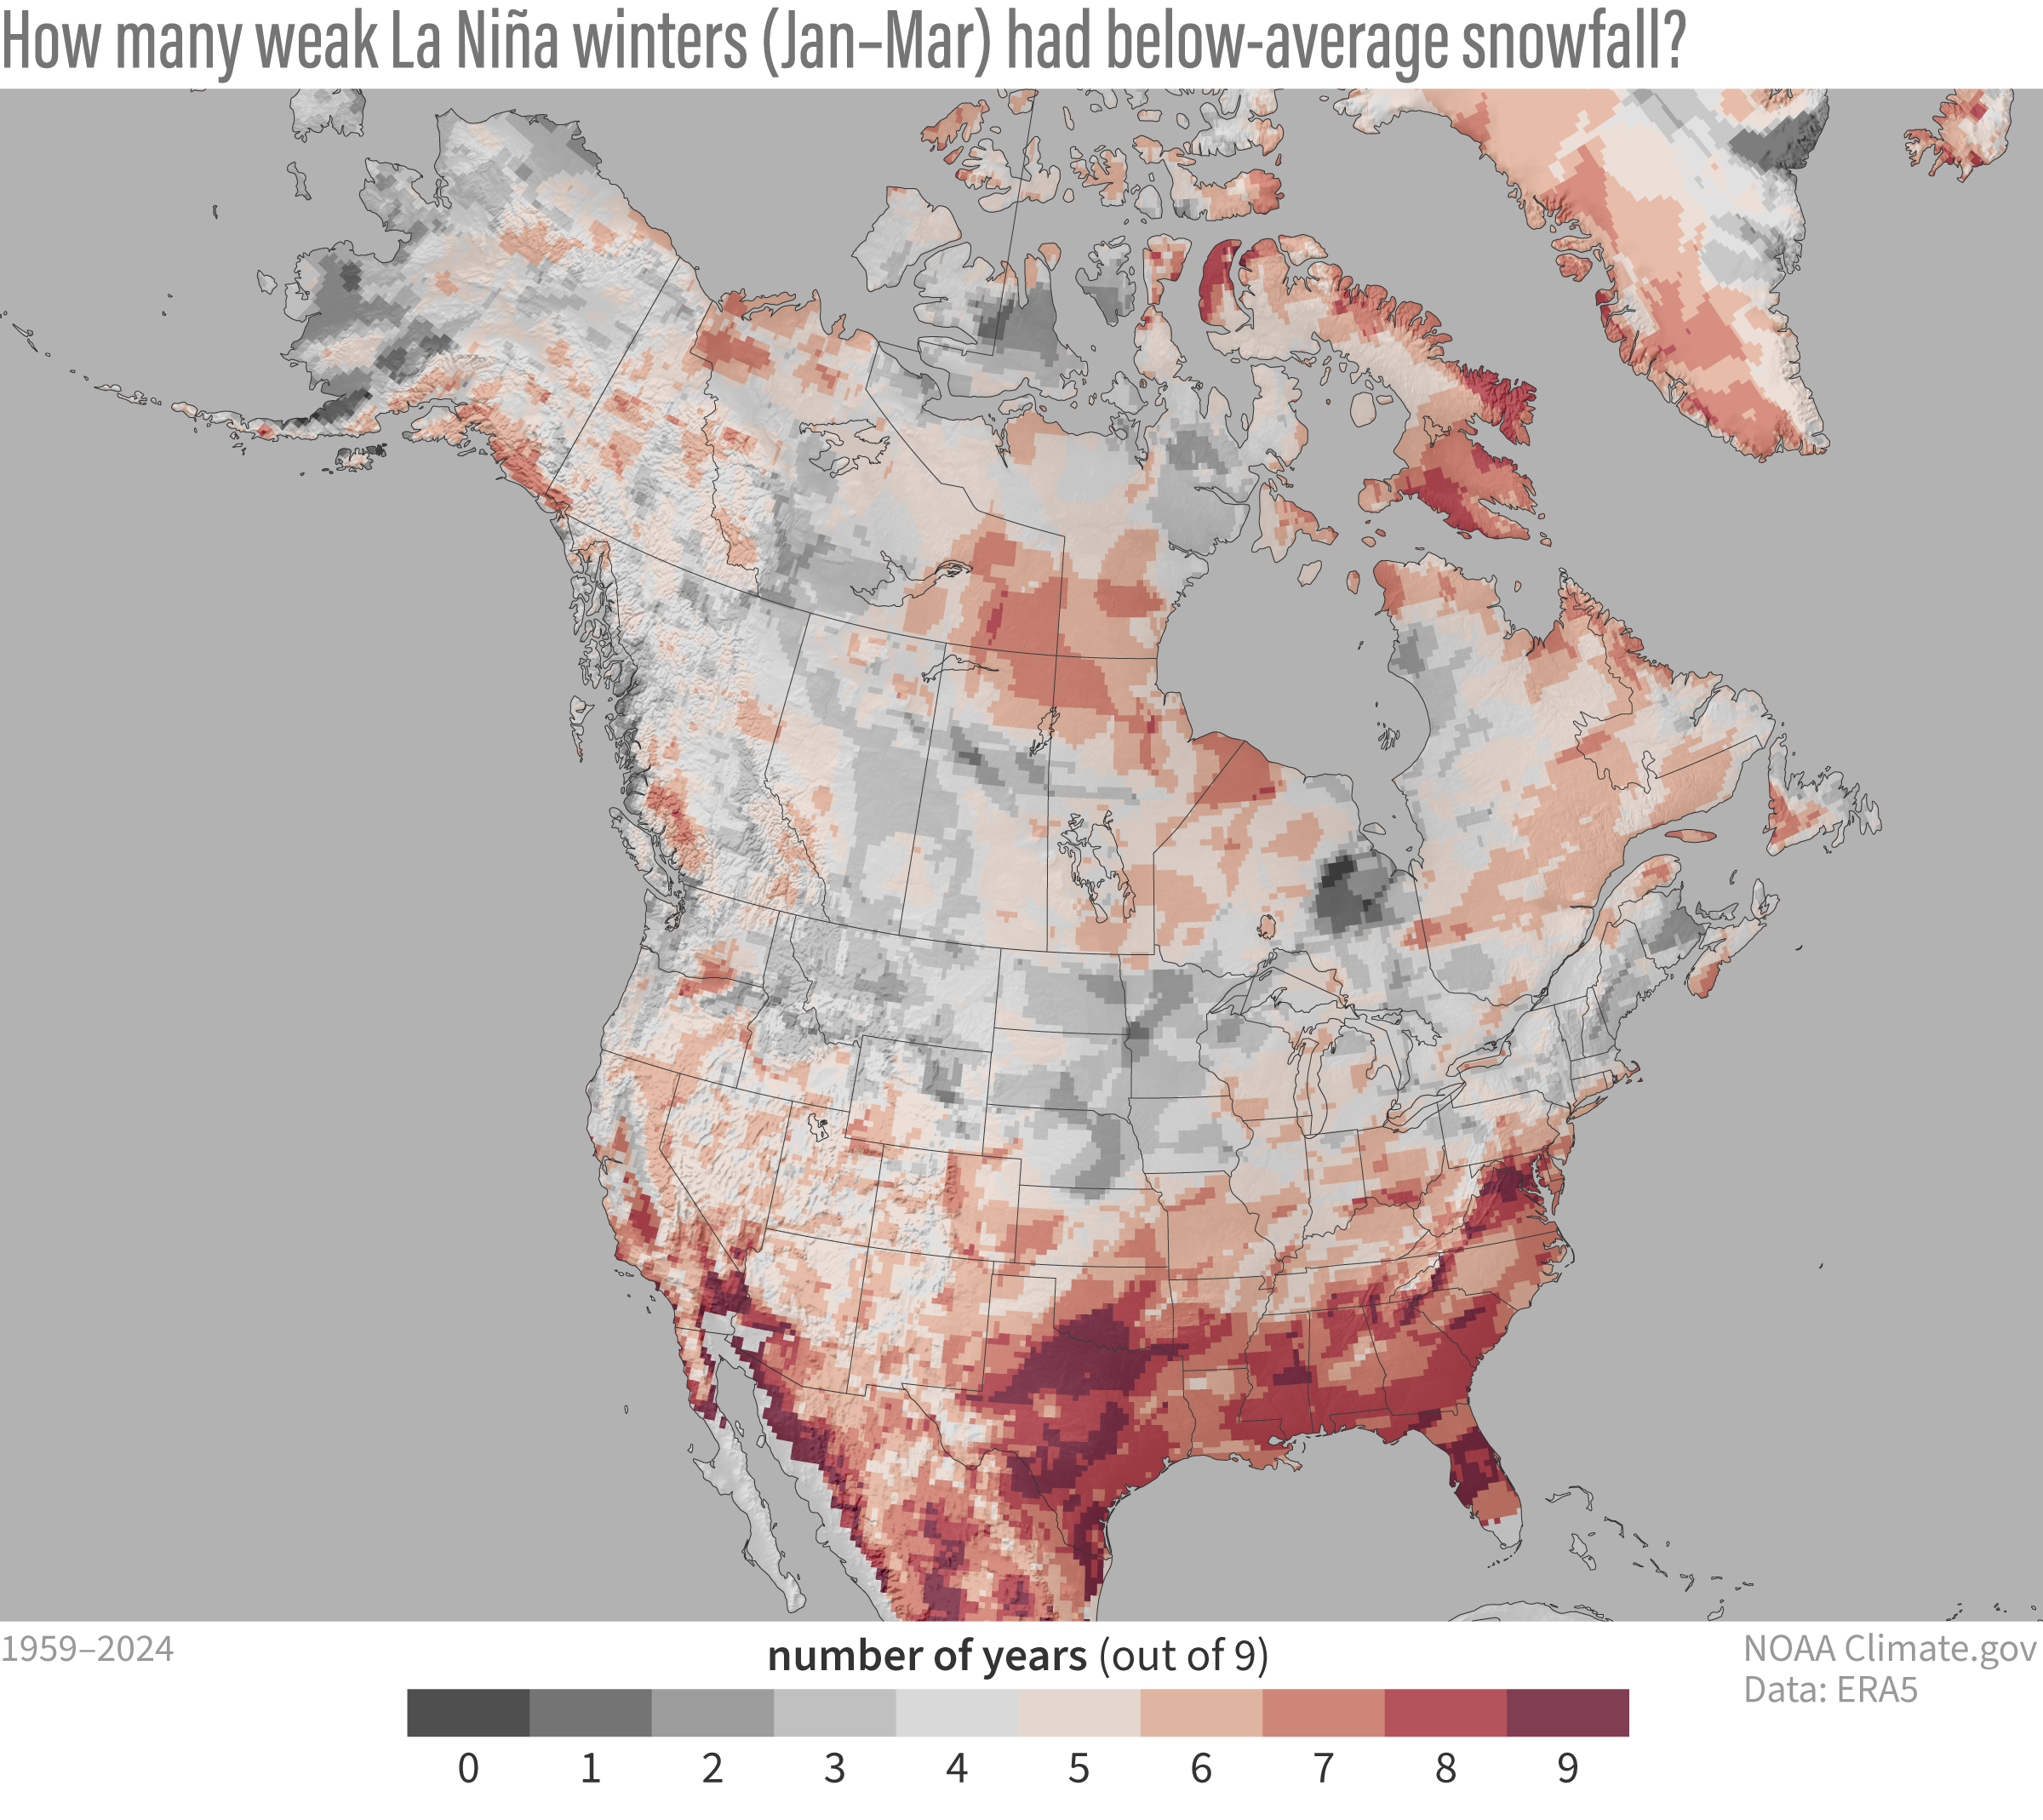
The count of how many (out of nine) weak La Nina events had below-average snowfall also showed similar patterns, with some bad news for those in Virginia, Maryland, and Washington, D.C., where every single weak La Niña winter had below-average snow.

This map shows how many of the 9 historical weak La Niña winters from 1959–2024 had below-average snowfall from January–March. Red colors mean those places had below-average snowfall more than half the time. Gray colors mean those places had below-average snowfall less than half the time. The long-term trend in snowfall over this period has been removed to better show the influence of weak La Niñas by themselves. NOAA Climate.gov map, based on ERA5 reanalysis data and analysis by Michelle L’Heureux.
[Editor's note: See the bonus section at the end of the post to compare the maps directly using an interactive slider].
Here is where you tell us about how climate change is affecting snow
La Niña isn’t the only story when it comes to snowfall across North America. An important note: the previous maps based on La Niña events have also had the long-term trends removed (footnote 3). We do that to see what impact La Niña had on snowfall by itself. In other words, how La Niña winters would have played out if there was no long-term change in snowfall to complicate things. But, there is a long-trend that has to be considered.

Changes in January–March snowfall across North America from 1959–2024. Most of the contiguous United States has seen a decline of snowfall (brown) over the period thanks to long-term warming. Farther north, where winter temperatures have room to warm and remain below freezing, snowfall has increased in places (blue). Such increases are consistent with global increases in atmospheric water vapor as a result of warming-driven evaporation. NOAA Climate.gov map, based on ERA5 reanalysis data and analysis by Michelle L’Heureux.
Human-caused climate change is making things warmer. And across many regions, winter is the fastest-warming season. Not surprisingly, over most of the contiguous United States, January-March snowfall has trended downwards. Less snow doesn’t necessarily mean less precipitation, though. In fact, for much of the Great Lakes and Northeast, precipitation has increased in winter. It just means that “would-be” snow is falling as rain due to warming temperatures.
What about areas farther north like Alaska? Well, an overall warmer atmosphere means the air can hold more moisture. When the atmosphere is wrung out, it means more precipitation. In places in the far north where temperatures are still cold enough for snow, that extra moisture translates into an increase in snow.
Good question. Just because snow is trending lower, or there is a La Niña, doesn’t mean there can’t be a big snowstorm in any given winter. It just might be harder for that to happen in some places. Basically, I’m telling you there’s a chance. Good luck, snow lovers!

In ski season roulette, a climate outlook will never completely crush a skier's hopes. Even for a hypothetical forecast for an 80% chance of a warmer-than-average winter, forecasters leave at least a small chance—by convention NOAA forecasters say 3.3%—that a cold winter will happen. And of course, a single big snow event can sometimes save an otherwise poor season. NOAA Climate.gov cartoon.
Footnotes
- We will go ahead and copy and paste the footnote from the El Niño-snowfall blog post!
We have to be careful to not take any one dataset literally, but this ECMWF ERA5 data seems to pass a few sniff tests. Sniff test #1 was “Does ERA5 snowfall reproduce the winter pattern of snowfall made with other datasets?” The answer, at least when comparing with winter 2022-23, is yes. Sniff test #2 was “Does ERA5 snowfall reproduce the historical ENSO pattern that is found within other datasets?” Here again, the answer is yes, we were able to reproduce ENSO composite maps that were made with the Rutgers gridded snow data in this older ENSO blog post.Sniff test #3 was comparing with our old ENSO snowfall composites made from an even older (not quality controlled) station-based dataset that has been discontinued.
With that said, ERA5 is a newer dataset, it is “reanalysis,” which means that a very short-range weather model is used to produce snowfall from in situ observations (from the ECMWF website, it outputs the “mass of snow that has fallen to the earth’s surface”). Essentially a reanalysis is predicting what observed snowfall would have looked like based on past observational inputs from satellites, stations, buoys, and other observing systems. Therefore, we recommend you treat some of the finer details with a healthy degree of suspicion and try to corroborate them in other datasets. Hopefully this blog post will motivate the creation of additional snowfall datasets and scientists will explore how well ERA5 compares with these other snowfall measurements.
Another aspect to keep in mind is that ERA5 snowfall is “Snowfall toward earth’s surface” which means measurements are not subjected to influence from pavement, canopy, surface winds, etc. which tend to reduce amounts actually measured at the surface (not to mention human error using a ruler).
- Some other major differences between the two snowfall datasets. The dataset used in the 2017 article looked at an October-April average over the 1949-2009 period, and compared that to the 1981-2010 climatology. The ERA5 Reanalysis dataset instead looks at the January-March period from 1959-2024, and compares to the 1991-2020 climatology. The “all La Nina event” snowfall anomaly pattern between both datasets is pretty similar. However, when comparing just the weak events, the newer dataset shows a stronger below-average snowfall signal across the Appalachians and Mid-Atlantic.
- To detrend the data, we subtracted a least-squares linear fit through the January–March season for the entire period of record.
Bonus section: Compare maps directly
Click and drag slider to compare January–March snowfall patterns during all historical La Niña winters (left of slider) to patterns during only weak La Niña winters (right of slider). During weak La Niña winters, the pattern of below-average snowfall amounts across the southern part of the United States is weaker in some places, for example, the southern Sierra Nevada Mountains in California, but stronger in others, including the Mid-Atlantic and the southern Appalachian Mountains.
Click and drag slider to compare the number years with below-average snowfall out of all La Niña winters (left of slider) to the number during only weak La Niña years (right of slider). During weak La Niña winters, the pattern of below-average snowfall amounts across the southern part of the United States and above-average snowfall across the North is somewhat less reliable.
Click and drag slider to compare the average snowfall pattern during all historical La Niñas (left of slider) and how many years followed that pattern (left of slider)
Click and drag slider to compare the average snowfall patterns during weak La Niñas (left of slider) to the number of years that followed the pattern (right of slider).
Comments
Best Measure of the Expected Value for Season-total Snowfall
Given the highly variable point values of season-total snowfall from year-to-year ... why is the 'average' the best measure of central tendency?
The average is not the…
The average is not the necessarily the best measure, but it is a compact way to articulate the general patterns. Hopefully the count maps make it clear that there is variation. For example, you can see some areas that are above-average in the composite average, but a majority of seasons were not above-average. The slider images at the bottom of the post can help identify those regions.
Then Why Not Use A More Robust Statistic ...
... such as the median?
We're sure you know the median is often the best measure when the data have extreme outliers so why not use it instead of the average which is much less representative of a season-total's snowfall?
Shouldn't you at least evaluate the difference?
Sure there are a lot of ways…
Sure there are a lot of ways to do this! My guess is the median is not that different from the mean in part because when you look at seasonal (3-month) averages most variables converge to a Gaussian (or nearly Gaussian) profile. But certainly that can be done.
Hard to see how season-total…
Hard to see how season-total snowfall can be assumed to be normally distribution considering these stratified counts of ENSO winters by state and strength.
As we're sure you know where normal distributions exist ... average will ~equal the median. Where normal distributions don't exist ... the analysis would be vastly improved by reporting deviations from the median.
---
J-F-M 1959 - 2024 (n=66)
what years
What years were used for the weak la Ninas?
JFM 1965, 1972, 1975, 1984,…
JFM 1965, 1972, 1975, 1984, 2001, 2006, 2009, 2018, and 2023. All were a weak La Nina in NDJ or DJF based on our Oceanic Nino index. Hope this helps.
Weak La Nina winters
Hi Michelle, using this chart as a guide, There does not seem to be much difference in outcome between weak and moderate La Ninas. This map does not contain most recent years.
I can see you attached…
I can see you attached something but unfortunately it filters out so I cannot see it. I would agree that there are not major changes from "weak La Nina" composites to "all La Nina" composites.
Precipitation (all types) during La Nina
While folks are concerned about decreasing snowfall, I'm wondering about how La Nina affects all types of precipitation, whether snow, rain, ice, etc. I'm specifically interested in the NE TN area. I've tried researching this but all I get is info on Nashville. I don't live in that area. I'm in the Northeast corner of the state and precipitation info is important for gardening/farming etc.
Any advice?
You can get the official…
You can get the official winter outlook from CPC at this link:
https://www.cpc.ncep.noaa.gov/products/predictions/long_range/seasonal.php?lead=2
On the left hand side there are different seasonal (3month average) forecasts.
La Nina years
Hi Michelle,
One of the authors on this blog posted this same image a few years back. It shows all the La Nina winters going 50 years I think. And it breaks the winters (Dec-Feb) down by strength. The map only goes up to 2010-2012. Hopefully it is updated to include the most recent La Nina years beginning in 2016-2017. It was created by the NOAA
Hi Bob - I think you're…
Hi Bob - I think you're thinking of Stephen Baxter's post from 2017. He used a dataset that is no longer updated, so these maps will have slight differences.
There was only...
one Winter where La Nina produce a very Cold and Snowy Winter here in the Ohio Valley, and that occured in 1917 - 18. It's the weak El Nino years that caused the Snowy Winter's 1969 - 70 and 1976 to 1978. I experence these Winters, and they were very exciting for all those who like Snow. My question is : Will this scenario ever occur again ? My last Snowstorm was in Evansville, Indiana December 23rd, 2004. What a very beautiful " White Christmas." Two feet of Snow on Christmas Morning. Where I live now, ( Central Kentucky ) in the past 16 years hardly any Snowstorms. I believe Man Made Global Warming has caused this area to be subject to Drought during the growing season and beginning to be Snow free whether were in a La Nina or an El Nino phase.
for the statistically-obsessed
By any chance could you add a map with the standard deviation of the map graphics which show average values? (Departure from normal precipitation, departure from normal average temperature, and so on)? The SD would serve to illustrate some context behind the averages presented above. Averages are worthless (I’m so mean!) without the context provided by knowing how relatively “tight” those departures from the mean are. Or, as a philosophical genius once put it, “Everything is relative, and nothing is absolute.”
One final note, I would like to see a “snowfall avoidance” number. As temperatures have trended upward, where I live we have experienced much less snowfall when the precipitation instead falls as rain. It sounds like a heavy, heavy lift to analyze this, but I am curious. Also as precipitation events have grown more intense, the inverse may also be true; how much worse have snowstorms gotten as the weather trends farther from average?
Add new comment